Weekly Review made easy(ier): The Power of Claude Cowork

For over almost two decades, my late Friday afternoons have been devoted to the weekly review — that ritual drawn from David Allen’s Getting Things Done methodology, where you step back, look at every open loop, and decide what truly matters for the week ahead. As a professor juggling a research program, an administrative portfolio, mentoring obligations, editorial duties, and the occasional plumbing emergency at home, the review is non-negotiable. Without it, things fall through the cracks. With it, I can enter Monday morning with clarity.

What has changed dramatically recently is how I conduct that review. While I still scroll through Reminders lists, I now have a scheduled Claude automation reads every one of my Apple Reminders lists, cross-references them against my week’s daily briefs (OCR’ed automatically from hand my written note, and produces a structured HTML report that I open in my browser each Friday afternoon. The entire process takes about two minutes of compute time and zero minutes of my attention until the report is ready.

The Problem That Needed Solving

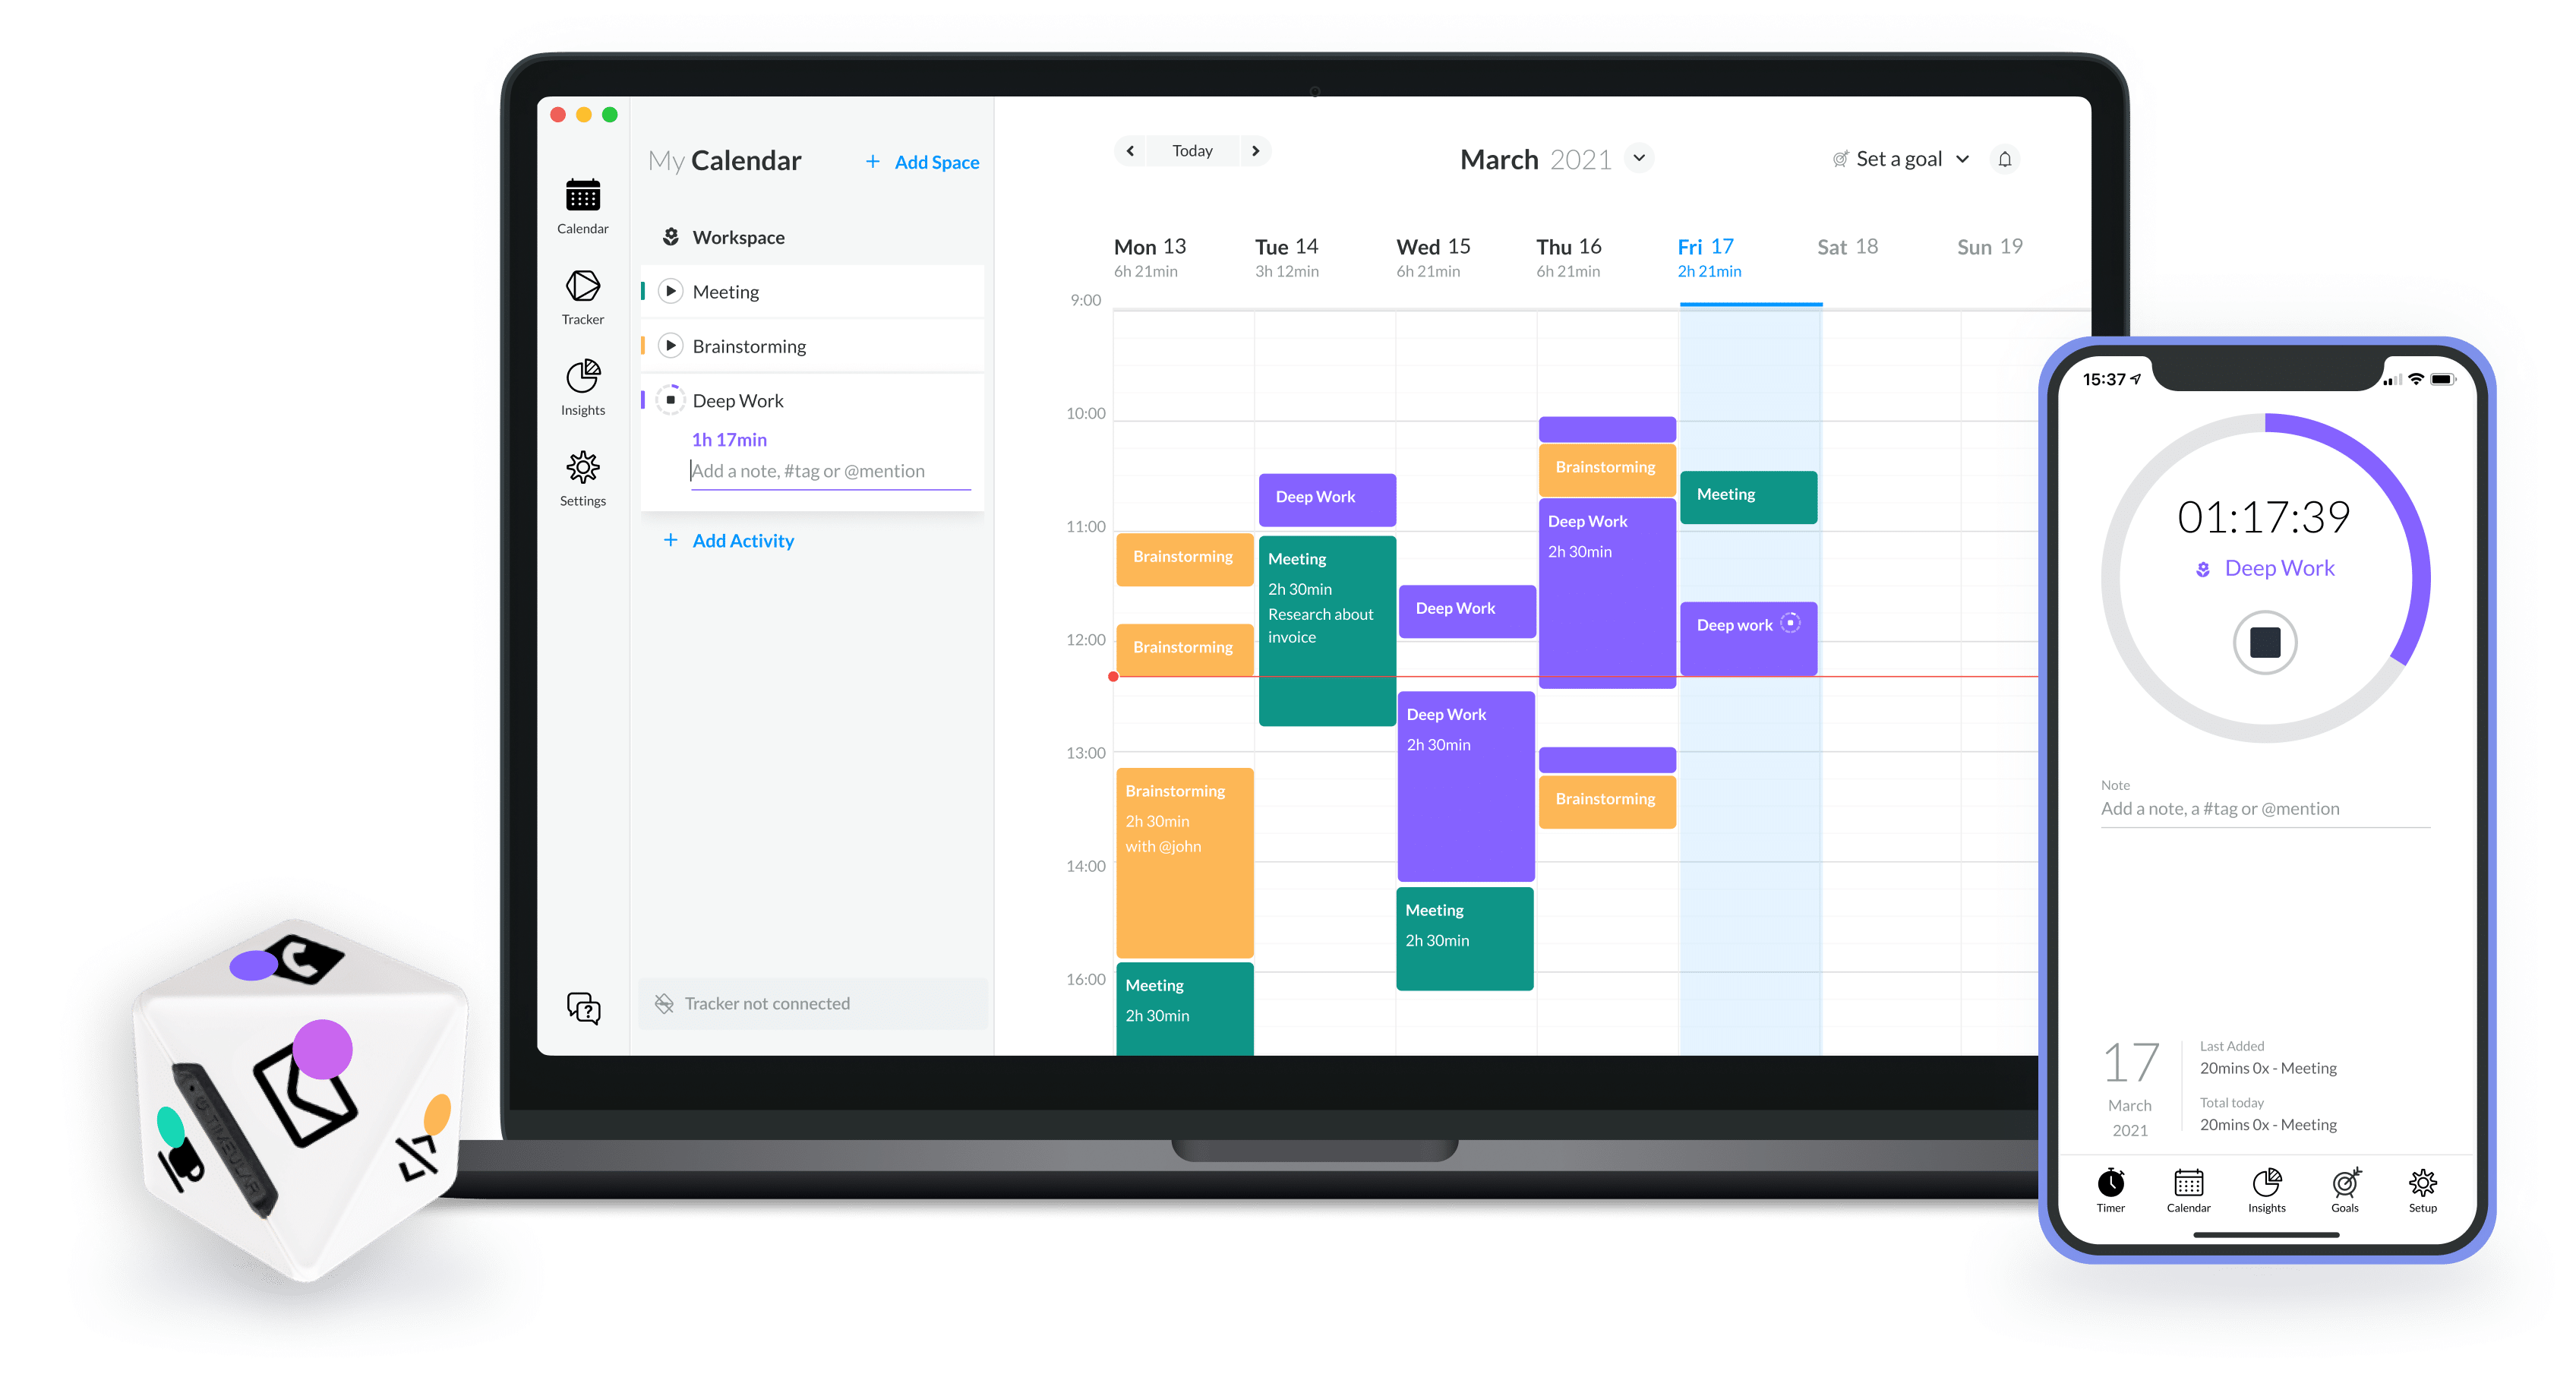
Apple Reminders has been my capture system of choice for the past two years, moving away from Cultured Code Things. It syncs instantly across every device, supports Siri dictation, allows file attachments, recurring tasks, location-based tasks, and integrates well with mail rules, shortcuts and scripting. Over the years, I have accumulated between 33-35 active lists at any one time, spanning professional domains (Research projects, Conferences, Mentoring, Review-Referee, administrative-institutional lists), personal categories (Family, Personal, Maintenance), a Waiting For list, and soft lists I think of as “someday/maybe” buckets (Might like to read, Incubating, Ideation, …). On any given Friday, there are north of 400 open reminders distributed across these lists.

The difficulty is not the volume per se — it is the cognitive overhead of context-switching between domains, spotting items that have become time-sensitive since they were captured, and identifying which tasks align with future calendar entries (yes, there is an MCP server for Claude!!!) the strategic priorities I have declared for the current session and week. Doing this manually takes about 1 to 1.5 hours, depending on the level of activity during a given week. Doing it well required a good level of attention that can be hard to sustain at the end of an already long week.

The Architecture

My solution relies on three components that are already part of my daily workflow:

  1. Apple Reminders as the single capture layer. Every actionable items ends up here, initially in the Inbox list.
  2. Claude’s Cowork mode running on my Mac, with the Apple Reminders MCP (Model Context Protocol) connector granting read access to every list. The one used is the apple-reminders MCP server by Dhravya Shah,. It is a Node-based MCP server that interfaces with Apple Reminders (and Calendar) via AppleScript bridges on macO.S
  3. A scheduled task configured to fire every Friday afternoon. The task prompt instructs Claude to query all lists, retrieve both open and recently completed reminders, and generate an HTML report following a precise template.

The scheduled task is defined in a single natural-language prompt. There is no Python script, no shortcut chain, no Zapier integration. The prompt describes the report structure I want, the analysis I expect, and the formatting conventions to follow. Claude handles the rest — iterating through the API calls to Apple Reminders, performing the cross-referencing logic, and writing the HTML file to my working folder, where a macOS Folder Action can optionally open it in the browser.

What the Report Contains

The generated HTML report is divided into six sections, each serving a distinct purpose in the review workflow:

Section 1 — Empty Lists. Lists with zero incomplete tasks. This is a hygiene check: if a list has been empty for several consecutive weeks, it may be a candidate for archiving. The report flags stale lists with a recommendation.

Section 2 — Completed Tasks This Week. Every reminder marked as done during the past seven days, grouped by list, with summary statistics showing which domains consumed the most effort. This is the “what did I actually accomplish” mirror, surprisingly motivating on weeks when it felt like nothing moved forward.

Section 3 — #Project-Tagged Completions. A filtered view of Section 2, isolating only tasks that carry a #Project tag. This lets me track progress on declared multiweek initiatives without noise from routine operational tasks.

Section 4 — Upcoming #Project Deadlines. Any #project-tagged reminder with a due date falling within the next 14 days. When the horizon is empty, Claude flags it as notable and lists the next known deadline further out, along with a warning if major projects have no due dates at all.

Section 5 — Inbox Triage Suggestions. The Inbox list is where everything lands before being sorted. Claude examines each item, proposes a destination list, assigns a priority level (normal, high, urgent), and provides a one-line rationale for the suggested move. This is the section I interact with most actively — it turns the Inbox from a guilt-inducing pile into a decision queue.

Section 6 — Strategic Task Promotion Audit. This is the most analytically ambitious section. Claude cross-references my undated reminders (typically around 400 items across all lists) against two sources of declared intent: the semester-level Top 3 priorities and the weekly Top 3 priorities recorded in my Maintenance list. The output is a three-tier table. Tier 1 identifies tasks that directly operationalize a stated priority but lack a due date — the classic gap between intention and execution. Tier 2 surfaces items with approaching or overdue external deadlines (conference registrations, manuscript reviews, grant forms). Tier 3 highlights dormant tasks that have gained renewed relevance from themes discussed in my week’s daily briefs.

What I Have Learned

Three observations stand out after running this system. First, the value of the report is not in the data extraction — it is in the editorial layer. Claude does not merely list tasks; it produces rationales, flags contradictions between stated priorities and actual behavior, and recommends specific actions. That editorial judgment, grounded in the context of my actual task landscape, is what transforms a list dump into a decision-support tool.

Second, the system is remarkably low-maintenance. The scheduled task prompt has been revised perhaps four times since I first wrote it, mostly to add Section 6 and refine the triage heuristics. Because the prompt is natural language, the iteration is trivial — I describe what I want differently, and next Friday’s report reflects the change.

Third, there is a real psychological benefit to receiving the report as a document rather than interacting with it conversationally. The HTML file is something I can print, annotate, and file. It creates a weekly record — an audit trail of what was open, what was closed, and what was flagged. Over time, these reports have become a lightweight project history that no other tool in my workflow provides.

The Template

For those interested in replicating or adopting this approach, I have also included a PDF of the template (see above) showing the complete structure of the report with all six sections and their subsections. Of course all entries are fictitious, but the layout and section logic are identical to what Claude generates each Friday.

An Insider Look at One’s Own Publications: Research Trajectories, Long-Term Impact and Mentorship

The great tragedy of science – the slaying of a beautiful hypothesis by an ugly fact.

Thomas Huxley

Reaching 300 peer-reviewed manuscripts (not counting peer-reviewed conference proceeding manuscripts) is a symbolic milestone in any academic career. With the recent publication of “Retrospective evaluation of high-dose-rate brachytherapy multicriteria planning using physical dose versus radiobiological criteria for prostate cancer” in Nature Scientific Reports, and after 30+ years of publishing, I decided to take a data-driven, deep-dive look at my own research portfolio.

My very first peer-reviewed manuscript was published in 1992, for which I was a co-author. My first first-authored peer-reviewed manuscript was published in Nuclear Physics A in 1994, two years later. The very first Medical Physics paper was published in 1999 while in a postdoctoral fellowship position in Berkeley for a study linked to cross-section measurements of neutron production in the context boron-neutron capture therapy. The 100th publication was in 2008 by Bazalova et al. (and is one the most cited manuscripts I collaborated on, with close to 300 citations at this time). The 200th peer-reviewed published manuscript was in 2017 by Miksys et al. has part of a collaboration with Carleton University.

Before turning to those analyses, it is worth situating this body of work within a broader, field-normalized publication and citation context. Since 2018, I have been listed among the top 2% most-cited researchers worldwide in my scientific field, based on the standardized bibliometric database developed by Ioannidis et al. (PLoS Biology, 2019). This classification, which is field-specific and based on composite citation indicators, has remained valid through successive updates up to 2025. In the 2025 release, my profile additionally entered the career-long (lifetime) top-2% category, alongside continued inclusion in the single-year top-2% cohort. Finally, according to OpenAlex data, my field (sub-field) weighted citation index (FWCI) is well above the world average.

The above external benchmarks provide an independent validation that the citation patterns discussed below are not merely internally consistent, but also competitive at the international level within my discipline.

The purpose of the present analysis is therefore not to establish rank, but to understand the mechanisms underlying sustained impact: how citations accumulate over time, how impact is distributed across publications, and how recent contributions compare to earlier work.

Raw publication and citations data

Data where extracted using Publish or Perish (see reference at the end of this post) software with Google Scholar as its source. All figures and analyses presented here were generated using Python. 

The intent is not boosting (many researchers have much better publication, citation and overall impact records than me), but understanding how long-term research programs evolve, accumulate influence, and remain relevant (at least I think so) over time.

Figures 1 and 2 above display the number of peer-reviewed manuscripts published per year (left), starting in 1992, and the number of citations every year (right) for the same time span. Note that I have excluded conference proceedings, published conference abstracts, book chapters, and patents from Figure 1 (even though these tend to have low citation counts if any). 

These figures illustrate three key periods in a scientific career. 

1992–2000 — First step in research: PhD and postdoctoral phase

• low but increasing productivity,

• typical early-career trajectory.

~2000–2013 — Expansion phase

• establishing and growing one research program,

• steady rise culminating around 2012,

• reflects peak trainee throughput and collaborative projects.

~2014–present — Mature mentoring regime

• high mentorship intensity with relatively stable productivity, 

• sustained funding environment,

• coherent long-term research themes,

 • strong citation accumulation continues despite stable output.

Total citations over time: why quadratic growth is expected

Figure 3 below shows the total cumulative number of citations per year from 1992 to 2025, together with a quadratic fit and its 95% prediction interval.

The most salient feature is the smooth quadratic increase in cumulative citations. Importantly, this behaviour does not imply accelerating impact per paper. Instead, it reflects a simple and well-understood cumulative mechanism:

• the cumulative number of publications grows approximately linearly with time,

• each paper continues to accrue citations year after year,

• older papers remain active contributors to the citation pool.

Mathematically, when a linearly growing publication base is integrated over time under roughly constant per-paper citation rates, the result is a quadratic growth law. The quadratic fit therefore has a mechanistic interpretation in which citation behaviour per paper has remained stable (on average), but the accumulation of work drives the curve.

Citation distributions: heterogeneity with structure

Aggregate trends can obscure important structure. To examine this, the citation distribution of individual manuscripts (≥1992) was analyzed using unbinned data and modeled in log–log space as shown in Figure 4 (below).

The obtained distribution is best described by a smooth double-Pareto model, characterized by:

• a low-citation (low-visibility, early-career, or new entries) regime, where scaling is weak or absent,

• a high-citation regime following a genuine power law with a slope above 2 (tail of the distribution),

• a smooth crossover at approximately 45 citations.

Importantly, the heavy-tailed component is not dominated by a single early contribution; it is populated repeatedly across the career span, indicating selective but sustained high impact. Double-Pareto distributions are observed across economics, urban systems, network science, and natural phenomena — preferential growth, entry of new contributors, selection, and saturation interact. Thus, the observed citation patterns can be explained within a broader class of adaptive systems. 

Moreover, the presence of a smooth crossover (rather than a sharp break) can be interpreted (I think) as evidence of healthy system evolution, where growth is neither unconstrained nor artificially capped. The observed citation distribution is somewhat related to Lotka’s Law, one of the earliest empirical laws of bibliometrics. While Lotka described the power-law distribution of scientific productivity across authors, the present analysis examines the problem of impact across papers with time for a single authors.

h-index, m-index, and temporal consistency

At present, looking at data from Google Scholar, the following can be extracted:

h-index = 62

• career m-index ≈ 1.8 (first peer-reviewed publication: 34 years ago)

• 5-year m-index ≈ 3, computed using only papers published in the last five years

An m-index close to 2 over more than three decades is well above the conventional benchmark (m ≈ 1) associated with sustained impact. More strikingly, the recent 5-year m-index exceeds the career average, demonstrating that newer publications are entering the h-core at least as fast as the earlier work: they are quite relevant to the field!

This pattern directly contradicts the late-career scenario in which citation metrics are driven primarily by legacy papers. Instead, it points to continued intellectual leadership and contemporary relevance. Layman (i.e. my) interpretation: I am not ready to retire yet; a few good ideas remain in this brain of mine 😉

Projection: what happens if nothing changes?

Using the quadratic and double Pareto models fitted to the 1992–2025 data, and assuming:

• stable publication rates,

• stable citation behaviour per paper,

• no change in the double-Pareto behaviour.

The expected total citation counts 10 years from now (2035) would be approximately 26,000 citations from about 420 manuscripts and an h-index close to or slightly above 80.

This projection does not rely on acceleration, step changes, or exceptional future events. It is the direct consequence of maintaining the same structural dynamics observed over the past decades. Alternatively, departure from this behaviour might signal major changes, either decrease or increase, in productivity. Will see …

What can—and cannot—be concluded

Taken together, the analyses support several, I would say robust conclusions:

• Citation growth is structurally cumulative, not speculative.

• Impact is heterogeneous but reproducible, with a persistent high-impact tail, i.e. continued entry of new work into the high-impact regime.

• Recent publications are at least as influential as earlier ones.

• Independent bibliometric indicators — time series, distributional models, and index-based metrics — are mutually consistent.

Equally important are the conclusions that cannot be drawn:

• There is no evidence of exponential runaway growth.

• No reliance on a small number of outlier papers – in fact, a large fraction of the published manuscripts have 10 or more citations (Google Scholar !10 index),

• No indication of declining relevance.

Not the finish line…yet!

From a bibliometrics standpoint, this combination — long-term stability coupled with ongoing contemporary strong performance — is both refreshing to the researcher I am and more informative than any single metric. What is perhaps less visible in bibliometric data, but no less important (I would even contend even more important), is how this body of work was produced.

During the first decade of my academic career, I was most often the first author or co-author on peer-reviewed manuscripts, reflecting a learning phase (under supervision!), establishing research directions, methods, and collaborations. Over the last two decades, this authorship pattern shifted completely. Today, approximately 78% of the manuscripts list trainees as first authors, spanning more than 200 individuals, from undergraduate researchers to postdoctoral fellows.

This transition is not incidental. It reflects a transition to independent researcher status and becoming an active supervisor and mentor. It also reflects on the strength and capacity of those themes to generate new questions, ideas, and solutions in the hands of emerging, bright young scientists. The sustained citation impact observed across the portfolio is therefore not driven by a single individual, but by the creativity, independence, and intellectual ownership of successive generations of trainees.

Seen from this perspective, this 300th peer-reviewed manuscript does not sit at the top of a personal achievement pyramid. It rests on a collective effort, built over time, in which mentoring, training, and scientific curiosity are inseparable from research output itself.  I have also always been incredibly blessed to have had supervisors and mentors that were wonderful human beings. They created environments that were conducive to open discussion. I learned early on that having and sharing a good idea is not dependent on your level as a trainee, and that level should not prevent you from expressing yourself. They further granted me autonomy in my research activities, allowing me to explore new techniques, approaches, and ideas. However, they also provided me with the necessary supervision to steer the project back on track when things veered off course; I was encouraged to make mistakes, and it was perfectly acceptable. 

Since then, I’ve been trying to replicate this approach.  I always tell trainees that coming to the lab and conducting research should be enjoyable.  It’s not always easy, and setbacks happen, but overall, the experience should be positive.

Thus, I will be eternally grateful to all the supervisors, mentors, colleagues, collaborators, but most of all the trainees that have joined (or will join) me in the roller-coaster adventure that is scientific research. It was, it is, and I hope, it will remain fun.

Reference

Ioannidis JPA, Baas J, Klavans R, Boyack KW. A standardized citation metrics author database annotated for scientific field. PLoS Biology. 2019;17(8):e3000384. https://doi.org/10.1371/journal.pbio.3000384

2025 update of the above manuscript accessible via DOI: 10.17632/btchxktzyw.8  (all data accessible, including the previous versions up to the first publication)

Harzing, A.W. (2007) Publish or Perish, available from https://harzing.com/resources/publish-or-perish

My Google Scholar page: https://scholar.google.com/citations?user=X4J8eVUAAAAJ&hl=fr

Opportunités MSc-PhD CAMPEP en Physique Médicale

Multiples ouvertures pour des projets de 2e (maitrise) et 3e cycle (PhD) portant sur des applications de concepts de physique, de génie et des méthodes numériques à la médecine dans le cadre de notre programme CAMPEP en physique médicale. Venez vous joindre à une équipe inclusive et diverse de plus de 25 personnes étudiantes et stagiaires postdoctoraux, et 24 physicien.ne.s médicaux. Vous aurez accès à de multiples plateformes de hautes technologies modernes (incluant un IRM-Linac), un milieu dynamique et interdisciplinaire avec de nombreuses occasions de présentations, collaborations et réseautage au niveau local, national et international. Une grande latitude vous sera accordée pour développer diverses compétences professionnelles selon vos objectifs.

Nous recherchons des personnes qui ont complété un diplôme de 1er cycle universitaire en physique ou génie physique, ayant une moyenne minimum de B ou l’équivalent. De plus, les qualités suivantes seront considérées comme des atouts :

  • Un intérêt démontré pour la science expérimentale ou la science numérique.
  • Une maîtrise des outils d’analyse numérique (Python, C/C++, etc.).
  • Un bon niveau d’autonomie.
  • Le désir de travailler dans un environnement multidisciplinaire.

Pour postuler, remplir ce formulaire en ligne https://forms.office.com/r/GHek4JTt8G : vous y déposerez un seul fichier PDF incluant dans l’ordre : 1) une lettre de motivation expliquant votre parcours avec les défis que vous avez relevés et vos intérêts de recherche (type de projet, sujets, etc.), 2) un CV et 3) tous vos relevés de notes de niveau universitaire. Pour questions : luc[dot]beaulieu@phy[dot]ulaval[dot]ca. Nous accepterons les candidatures jusqu’au 18 octobre 2024.

*Pour les personnes éligibles désirant postuler aux concours de bourses du CRSNG et FRQ de l’automne, il nous fera plaisir de vous parrainer. Dans ce cas, s.v.p. contactez-nous directement le plus rapidement possible et avant le 24 septembre (pour respecter les limites des organismes).

** Note that our CAMPEP graduate program is a French speaking program. While the research section can be conducted in English, teaching and interaction with the clinical staff are conducted in French and the willingness to acquire a basic proficiency in French is mandatory.

Freakonomics Podcast and Mr. Feynman

“I would rather have questions that can’t be answered than answers that can’t be questioned.”

― Richard Feynman

I recently discovered a new podcast called Freakonomics, which had an interesting question as title: Why Is There So Much Fraud in Academia?

But soon after moved on to three extremely interesting episodes called the Curious (part 1), the Brillant (part 2) and the Vanishing (part 3) Mr. Feynman. Even if you read the books, or just because you saw this guy playing bongo in the movie Oppenheimer, these provide an interesting look into Feynman’s life as seen by friends and his daughter.

Time tracking over an 18 months period: what was learned

“Your time is limited, so don’t waste it living someone else’s life.” 

– Steve Jobs

The COVID pandemic made many of us realize that we were spending a lot of time on things that brought very little in terms of quality of life or productivity. Transit time was a clear example, with many of us spending hours daily in traffic. This time suddenly became available, and we loved it. We discovered that tasks we had been putting off became “easy,” or at least easier to tackle. For me, the second item I was trying to get a handle on was the time spent on emails.

After listening to the Time and Attention podcast by Chris Bailey, I decided to try Timeular, which combines a physical device with software. The device is an eight-sided tracker that detects which face it is resting on. In the software, each face is associated with an activity. Tracking stops when the tracker is placed on its holder, though you can also manually enter time in the software.

After using it for more than 18 months, I wish it had 10 or 12 faces, as there are things I would like to track in finer detail (and I do not want to buy a second tracker). However, it is sufficient for a broad overview in an automated fashion.

I set up the tracker with the following categories:

  • Review/Write: This includes all reviews of trainees’ manuscripts, master’s and PhD theses, as well as my own writing. I would prefer to have writing as separate categories.
  • Research, Planning and Mentoring: I combine these since much of the mentoring is linked to planning research projects, experiments, data taking, and analysis with trainees.
  • Teaching: This encompasses formal undergraduate and graduate teaching activities, including preparation, in-class time, and grading.
  • Email!
  • Maintenance: This primarily involves my weekly review and a few related tasks, such as annual reviews, all ensuring that my system works and is always up to date.
  • Administrative Duties: This includes institution committees, CAMPEP program-related activities, etc.
  • Scientific Meetings and Conferences, self-explanatory.
  • Break, lunch time and other distraction that arise during the working hours.

Note that I do not track my vacation time, transit time (though perhaps I should!), jogging/training time, screen time outside of work, social media time, etc. Timeular now has (in beta) an automatic tracking feature for the applications you use, in addition to the tracker itself. In the Apple ecosystem, Screen Time tracking across all your devices is also available.

In 2023, the first full calendar year I recorded, I logged over 1900 hours despite being on strike for several weeks and taking my full vacation allotment (23 days vacation + 12 days spread out through the years). It was an excellent year, with significant achievements including graduating 15 trainees, contributing to committees for 6 more, and publishing 14 manuscripts, one of them being an international report and another a first-in men clinical trial for a novel technology project I have been involved with since 2011.

For those who wonder about break/lunch, only 11% of these hours were in that category. This is on the low side for a creative field such as scientific research. Note that if you take a 5-minute break every hour, 1 hour for lunch and work 8 hours, this results in a 580-minute day, with 100 minutes (17%) being break/lunch time. According to one extensive time-tracking study, the top 10% most productive people take even more break with a 17-minute break for every 52 minutes of work.

Interestingly, teaching was only my fourth most time-consuming activity. This includes time spent in class as well as preparation and grading. This is because during the summer semester, when there is no formal teaching, I dedicate 100% of my time to other activities, primarily research. In the Fall and Winter semesters, the time dedicated to teaching increases significantly.

In 2023, I spent 6% of my time on emails, totalling 115 hours. Think about it, this is close to 3 weeks per year!  When I started time tracking, my average was nearly twice that. I very quickly changed my email habits by:

  • Avoiding emails in the evening (I really try to stick to this as much as possible).
  • Using a VIP list for urgent emails.
  • Reducing the frequency of checking my email during the day.
  • Avoiding emails on weekends.

Within a few weeks, my average email time reduced to an average of 34 minutes during workdays. This includes an end-of-day inbox cleanup, when quickly reply to things that take less then 2 min and transform into a task anything that needs more serious attention or work. I do a deeper cleanup of all of my inboxes, including e-mail, during my weekly Maintenance session. I further notice that my average tracking entry length when up from 38 min to 61 min, leading to better use of larger chunk of time during the day.

I schedule a Maintenance event in my agenda every Friday afternoon for 90 min. This is were I review all of my inboxes, get everything sorted in my task manager and document manager, review ongoing projects, Waiting For tasks, backburner projects, …,  review the previous week and plan the upcoming week. Some weeks, I need less than 90 min and others I will take a full 2h. I am also planning 1.5 days before the Holidays break for a full review and cleanup of all of my completed projects (archiving documents and e-mails associated with those projects as needed) and set the stage (high altitude planning) for the upcoming year. Overall, this account of 5% of my time (110h last year) but this is an investment and the return on that investment pays for itself.

In 2023, mentoring, research planning, and reviewing documents took up the largest share of my time at 37%. Including time spent at scientific conferences, this accounts for nearly 50% of my time in direct service to research activities.  I suspect that this will and should be true every year. This is also quite interesting as for a long time, I held a position where I was 50% clinical medical physicist and 50% research physicist. Moving to a university position, did not change the amount of time dedicated to research (and related activities) in the end…

Administrative tasks represented about 16% (or 307h) of my time in 2023. Some of these are built-in my job e.g. the direction of our CAMPEP program, our department faculty meetings and so on. 

Comparing the Fall semesters of 2022 and 2023, I noticed a pattern. September (start of the school year for us in Canada) and November are particularly busy, with a higher workload due to grant proposals, recommendation letters, and administrative tasks. December is also intense due to year-end activities.

The number of hours/month logged in these 4-month periods is:

1- Higher on average than the rest of the year. Furthermore, September and November have the highest time logged in both years. The monthly average for the other months is around 153h/month (for 2023, the only full year I have). 

2- September (entrance, grants, letters, …) and November (everyone want their things done before the holidays and usually little happen past December 20th or 21st on the admin side, just the professors grading their finals) require a higher output, usually well above our work contract (on average this is always true, but still much higher)

3- October 2022 was low but there was also mortality on the family. In December, considering that I am out for a full weeks, it seems a lot had to be done in a short amount of time and this is true for both 2022 and 2023.

4- Notice how more hours logged in 2023 relative to 2022: record number of thesis to review and PhD thesis defence in addition to the normal workload!

In conclusion, time logging offers valuable perspective. It has helped me manage my email time more efficiently and recognize the actual hours spent “truly” working. As a creative professional, tracking time reveals that one might work fewer hours than perceived, given the brain’s limitations in sustaining concentration on creative tasks for extended periods. Since the pandemic, I have been trying to reduce my work week by concentrating on what I consider key tasks/projects, folding in the need for breaks. I have clearly failed in that regards for the Fall of 2023, but it was also an extremely satisfying four months 

Looking back at our 2023 Medical Physics Program

“In looking back, I see nothing to regret and little to correct.” 
John C. Calhoun

2023 was a spectacular year for our CAMPEP medical physics graduate program. We have graduated a record number of 13 students, 4 PhD and 9 masters (a few photos of PhD thesis defenses and master colloquium are given below). The majority in both categories were women, by the way. 

From 2011, the first year of accreditation, to 2018, only two out of 16 PhD graduates were women while master graduates were about 50-50. In the last 5 years, 8 out of 11 PhD graduates were women.  This year, the radiation physics graduate course was the most diverse ever with students from 6 countries and, for two of the last three years, a majority of women (cf. top right photo)!

This is interesting on many fronts. First, as a program sitting in the Faculty of Sciences and Engineering (we are part of the physics and physics engineering department), Medical Physics standout for being a diverse, inclusive and welcoming environment for graduate students. At the same time, it is recognized to be a tougher program than a regular physics master program due to its enhanced course curriculum combined to the same research requirement. Second, Quebec City is still not a major destination for immigration (while it is for tourisms) and immigration makes for only 7-8% of its population (will see the progression when we have access to the most recent statistics): harsh winter but mainly language (French) is a major barrier for many. So our natural catch basin, at least at the undergraduate level, from the Eastern Quebec is rather quite homogeneous to start with. 

I have been extremely happy by our out-of-country students’ ability to learn French quickly and being able to follow graduate courses and interact with our RadOnc department staff in French within their first year. Some have presented their master colloquium in French and even wrote their thesis in French!

Kudos to all of the Faculty (most appear on the photo in the bottom left) who contributed to this success.

Figure: Thesis defense and master colloquium (upper left quadrant), Fall 2023 radiation physics course (upper right quadrant), our university hospital medical physics teams and Faculty as of Summer 2023 (incomplete – lower left quadrant) and our trainees contingent from undergraduate students to postdoctoral fellows, Spring 2023 (lower right quadrant).