
Over two years ago, I made a proposal for a 20 000-foot Kanban-like visualization concept for Cultured Code Things 3 task manager. This was in order to go beyond the day-to-day task level and, in a single look, provides a portrait on everything on your plate. The very first version was made available based on my (limited) SQL, Python and modern HTML coding 😉
I have been using KanbanView as part of my weekly review since then. It helps me provide a critical overview of all my ongoing projects, in particular all of my research projects, writing (including grant proposals) projects and ongoing graduate students / mentoring. A critical component is to visually view all of them as once (Kanban style!) and each column displayed as function of deadlines so it makes easier to assign priorities. Another key component was the ability to fetch orphan projects i.e. those that are missing their very next action items (next doable task for each) and also quickly show back burner projects.
The COVID situation and the confinement that followed was a great time to revisit this concept. Thanks to Alex Willner from The Fraunhoffer Institute and Berlin Technical University, a brand new KanbanView version 2 has seen the light of the day with enhanced capability. You can use it to visualize both tasks and projects (10 000 and 20 000 feet views). However this revisited KanbanView provides statistics of your work and more importantly for your weekly review, spot very quickly orphan tasks (not attach to any projects) or orphan projects (with no next step planned) as well as quickly have a hold on all of your Waiting For tasks, Someday tasks and projects. The latter capability of the new KanbanView makes it a really powerful tool to make sure nothing falls into the cracks , especially if you have lots of Areas and Projects in Things these could easily be missed.
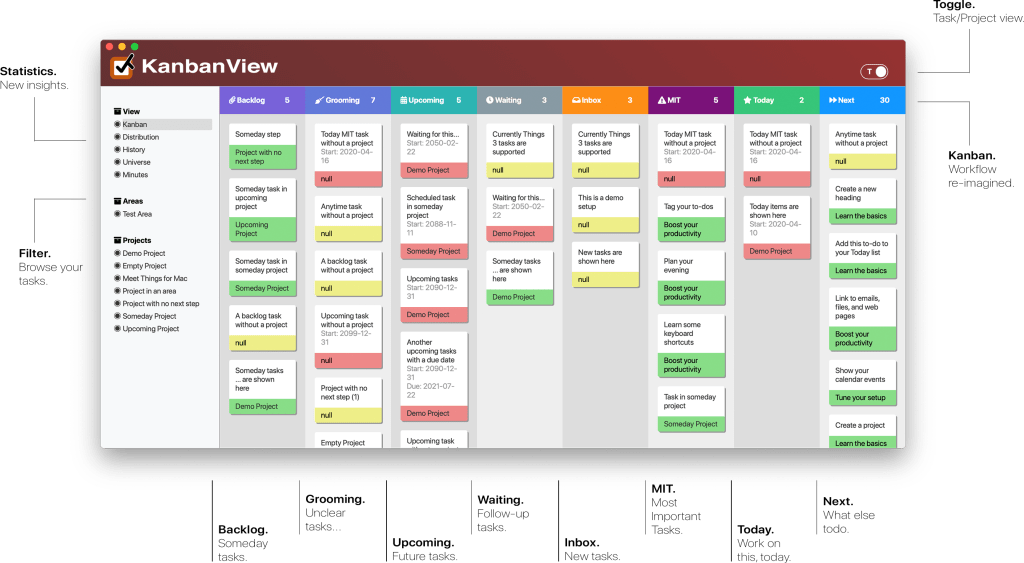
The interface as shown above is extremely clean. The toggle between Task (T) and Project (P) is selectable at the top right. The panel on the left let you display a KanbanView or other options (Eisenhower matrix, projects lifetime, statistics on tasks created, closed, canceled and trashed, …) as well as the full list of all your areas of responsibility and projects under each of them. At any point you can select a list in that left panel and have a KanbanView of either the projects (if an Area selected) or tasks (Area or Project selected).
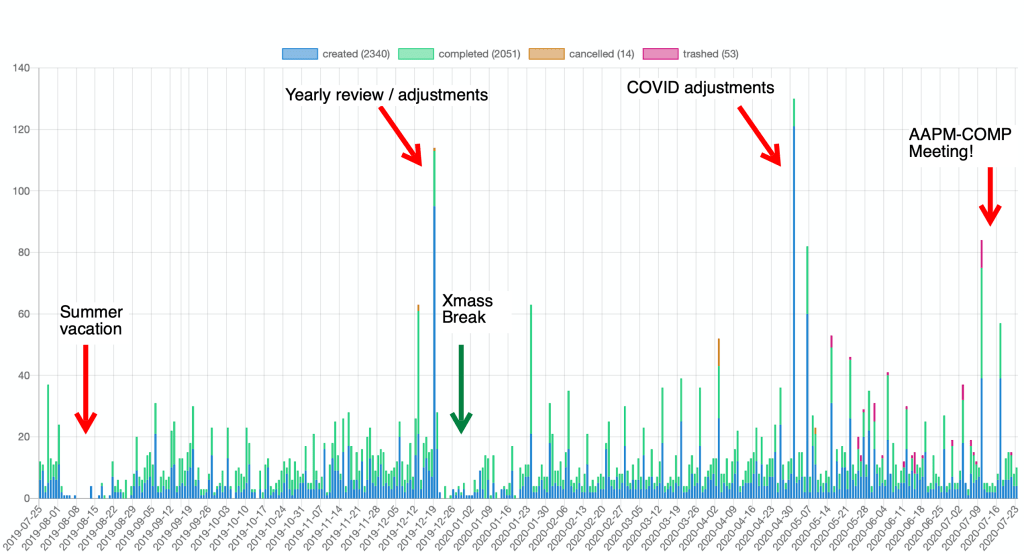
The statistics section displayed above is quite interesting. Above is a screenshot from my own database. The first thing that will strike you is a picket fence pattern with clear longer histogram bars at regular intervals: these correspond to my weekly review time! You can also spot very easily my off/vacation time in the summer (August – as well as peak in July just before vacation, making sure nothing is left in my head before leaving!) and around Xmas break, as well as the large peak corresponding to my annual review / system cleanup and adjustments. More importantly for 2020, you can see the major adjustments steaming from the COVID-19 situation (here it coincided with the planning for the reopening of my research lab and preparation for the summer and fall semesters). You can also spot some increase activities around March 12 (start of confinement) and more items early May as supplemental information became available. The other options available in KanbanView 2 also provide very informative statistics about your projects, timespan and so on.
Alex was nice enough to bring me in for testing in the early development phase and integrate a lot of the comments very quickly. The code based evolved also very quickly and Alex coding skills are obviously way better than mine! In the end, he brought a lot of new features such as letting you defined, via a preference section, which tags correspond to your most important tasks (MIT). For myself, I have set it to a Read-Review tag so that at any moment I have the full lists of all the documents I need to review (students’ documents, manuscripts, grants, …). He also made it possible to access KanbanView (an html document in the end) on your tablet. Furthermore, many other options are under consideration such as Gantt view (which would be cool I think for projects).
But even better, he made a compiled version, yes an app, which also runs in the background and sync in real time with your Things app. I strongly invite you to head to KanbanView web page, follow the link to the macOS App Store and encourage future development of the app by buying KanbanView 2 (I have). It is a few $ (3.99$ CAD, on the Canadian App store) well invested; If you are a Cultured Code Things user, you will not be disappointed.

Pingback: A Comparative Analysis of Cultured Code Things and Apple Reminders – Ruminating…
Pingback: Holistic Productivity: Productivity during a pandemic – Ruminating…
Thank you, highly appreciated!
LikeLike
I really love the app!
LikeLike