The great tragedy of science – the slaying of a beautiful hypothesis by an ugly fact.
Thomas Huxley
Reaching 300 peer-reviewed manuscripts (not counting peer-reviewed conference proceeding manuscripts) is a symbolic milestone in any academic career. With the recent publication of “Retrospective evaluation of high-dose-rate brachytherapy multicriteria planning using physical dose versus radiobiological criteria for prostate cancer” in Nature Scientific Reports, and after 30+ years of publishing, I decided to take a data-driven, deep-dive look at my own research portfolio.
My very first peer-reviewed manuscript was published in 1992, for which I was a co-author. My first first-authored peer-reviewed manuscript was published in Nuclear Physics A in 1994, two years later. The very first Medical Physics paper was published in 1999 while in a postdoctoral fellowship position in Berkeley for a study linked to cross-section measurements of neutron production in the context boron-neutron capture therapy. The 100th publication was in 2008 by Bazalova et al. (and is one the most cited manuscripts I collaborated on, with close to 300 citations at this time). The 200th peer-reviewed published manuscript was in 2017 by Miksys et al. has part of a collaboration with Carleton University.
Before turning to those analyses, it is worth situating this body of work within a broader, field-normalized publication and citation context. Since 2018, I have been listed among the top 2% most-cited researchers worldwide in my scientific field, based on the standardized bibliometric database developed by Ioannidis et al. (PLoS Biology, 2019). This classification, which is field-specific and based on composite citation indicators, has remained valid through successive updates up to 2025. In the 2025 release, my profile additionally entered the career-long (lifetime) top-2% category, alongside continued inclusion in the single-year top-2% cohort. Finally, according to OpenAlex data, my field (sub-field) weighted citation index (FWCI) is well above the world average.
The above external benchmarks provide an independent validation that the citation patterns discussed below are not merely internally consistent, but also competitive at the international level within my discipline.
The purpose of the present analysis is therefore not to establish rank, but to understand the mechanisms underlying sustained impact: how citations accumulate over time, how impact is distributed across publications, and how recent contributions compare to earlier work.
Raw publication and citations data
Data where extracted using Publish or Perish (see reference at the end of this post) software with Google Scholar as its source. All figures and analyses presented here were generated using Python.
The intent is not boosting (many researchers have much better publication, citation and overall impact records than me), but understanding how long-term research programs evolve, accumulate influence, and remain relevant (at least I think so) over time.
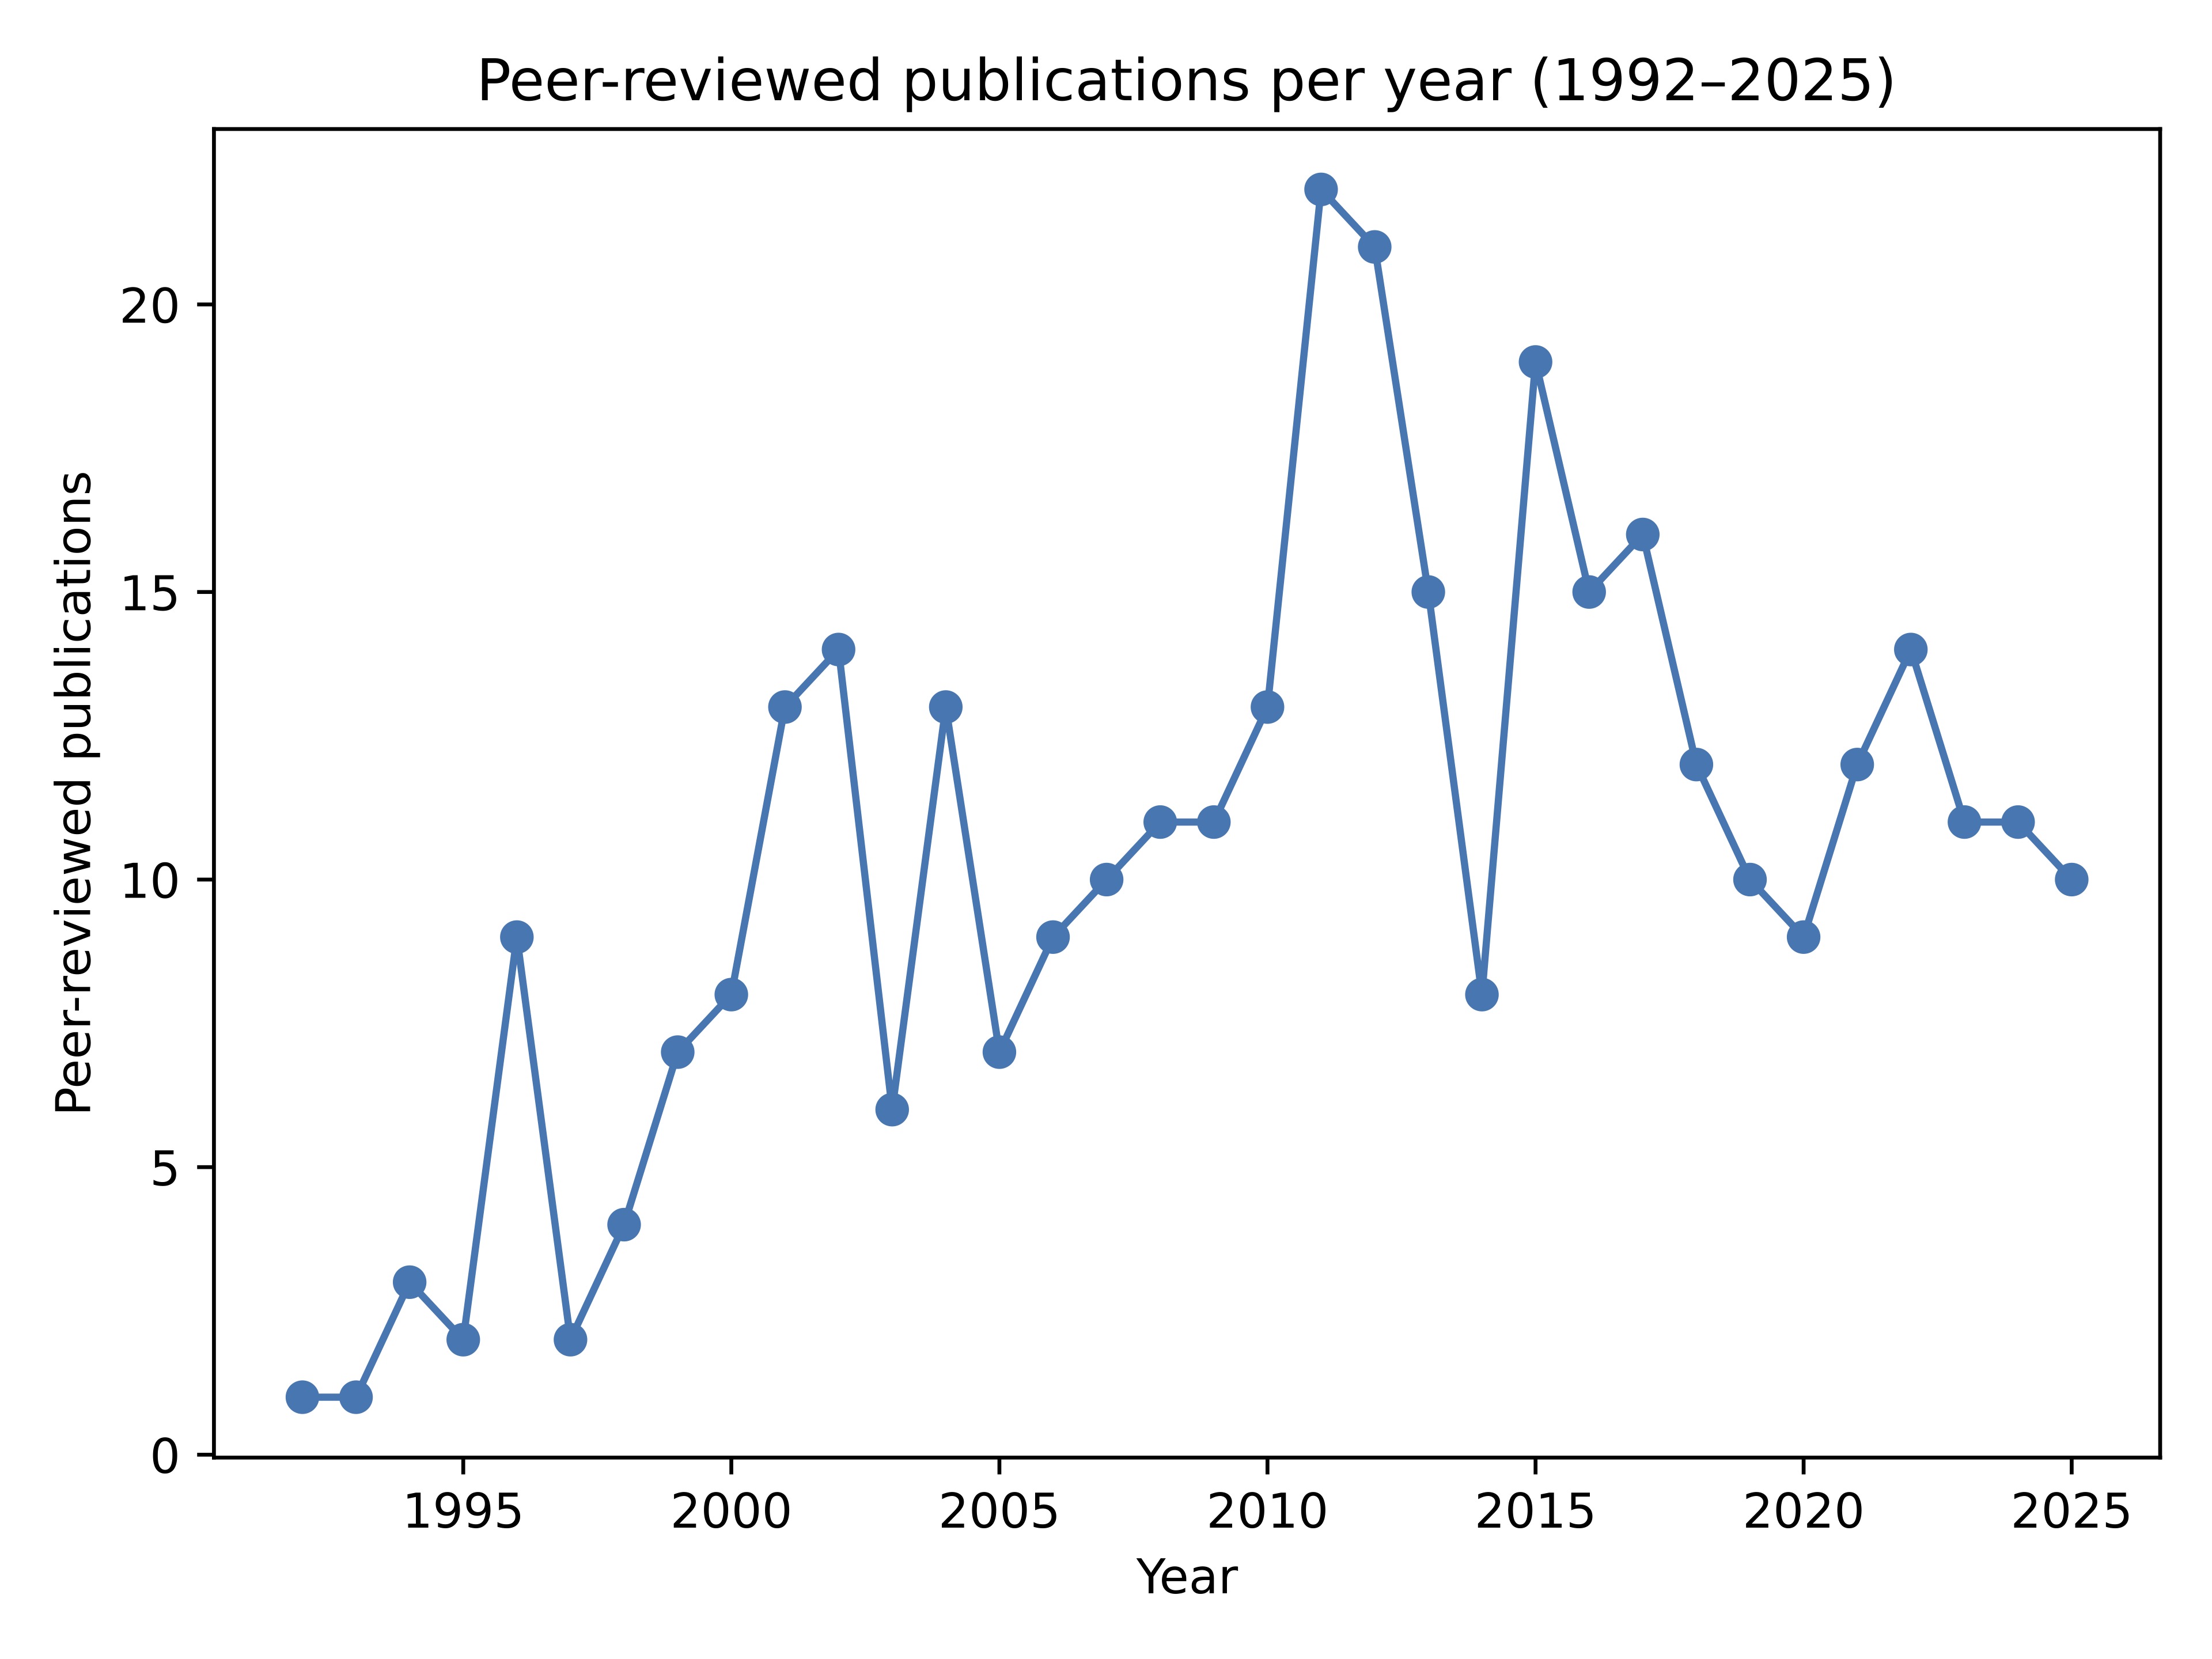
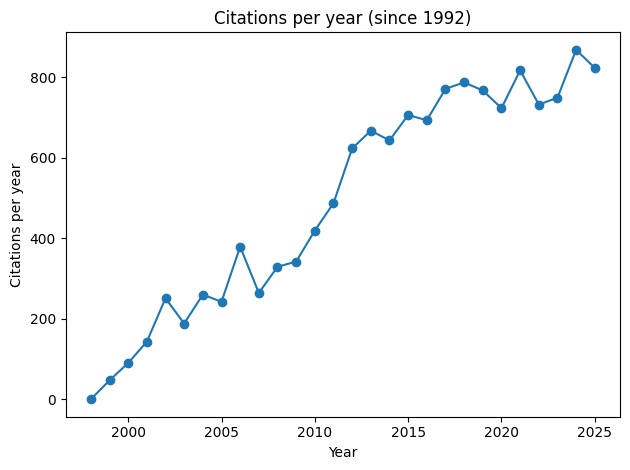
Figures 1 and 2 above display the number of peer-reviewed manuscripts published per year (left), starting in 1992, and the number of citations every year (right) for the same time span. Note that I have excluded conference proceedings, published conference abstracts, book chapters, and patents from Figure 1 (even though these tend to have low citation counts if any).
These figures illustrate three key periods in a scientific career.
1992–2000 — First step in research: PhD and postdoctoral phase
• low but increasing productivity,
• typical early-career trajectory.
~2000–2013 — Expansion phase
• establishing and growing one research program,
• steady rise culminating around 2012,
• reflects peak trainee throughput and collaborative projects.
~2014–present — Mature mentoring regime
• high mentorship intensity with relatively stable productivity,
• sustained funding environment,
• coherent long-term research themes,
• strong citation accumulation continues despite stable output.
Total citations over time: why quadratic growth is expected
Figure 3 below shows the total cumulative number of citations per year from 1992 to 2025, together with a quadratic fit and its 95% prediction interval.
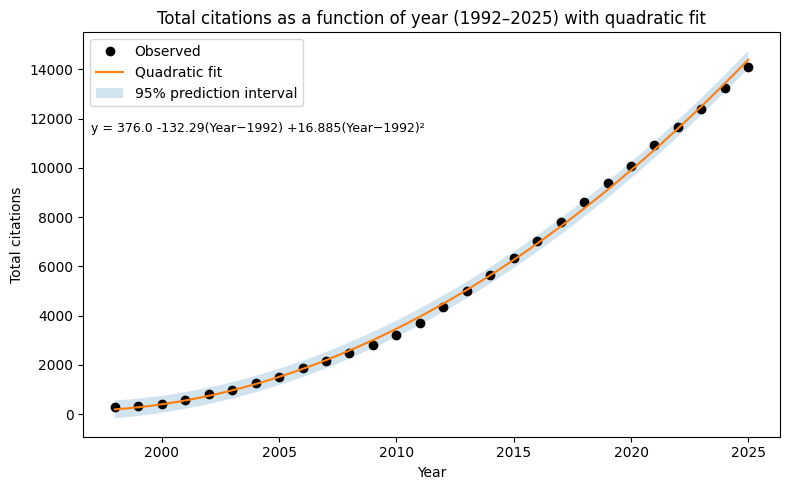
The most salient feature is the smooth quadratic increase in cumulative citations. Importantly, this behaviour does not imply accelerating impact per paper. Instead, it reflects a simple and well-understood cumulative mechanism:
• the cumulative number of publications grows approximately linearly with time,
• each paper continues to accrue citations year after year,
• older papers remain active contributors to the citation pool.
Mathematically, when a linearly growing publication base is integrated over time under roughly constant per-paper citation rates, the result is a quadratic growth law. The quadratic fit therefore has a mechanistic interpretation in which citation behaviour per paper has remained stable (on average), but the accumulation of work drives the curve.
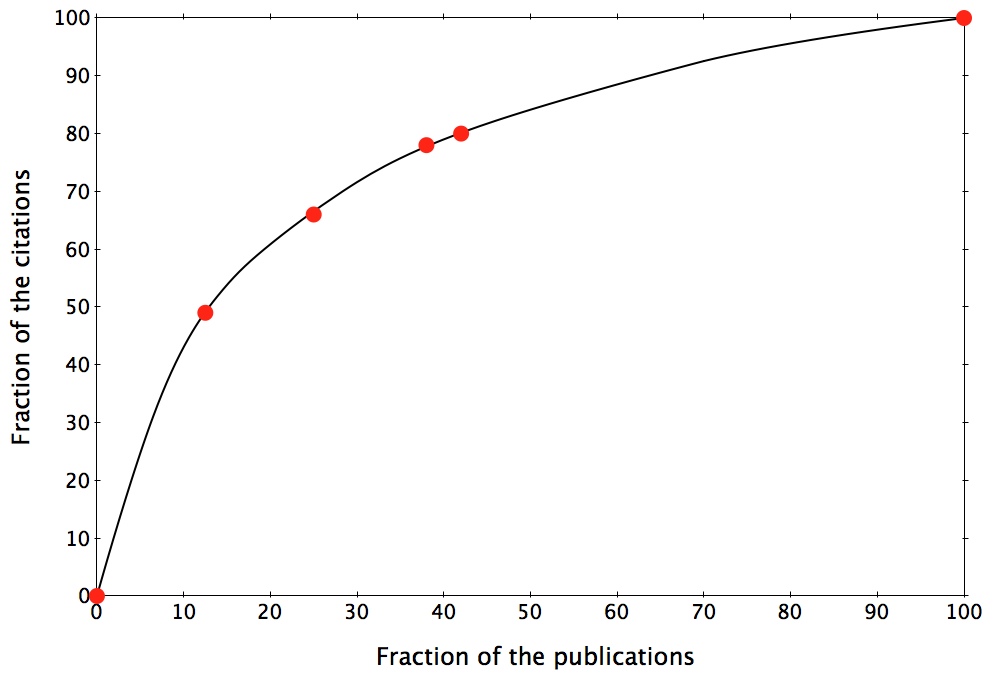
Citation distributions: heterogeneity with structure
Aggregate trends can obscure important structure. To examine this, the citation distribution of individual manuscripts (≥1992) was analyzed using unbinned data and modeled in log–log space as shown in Figure 4 (below).
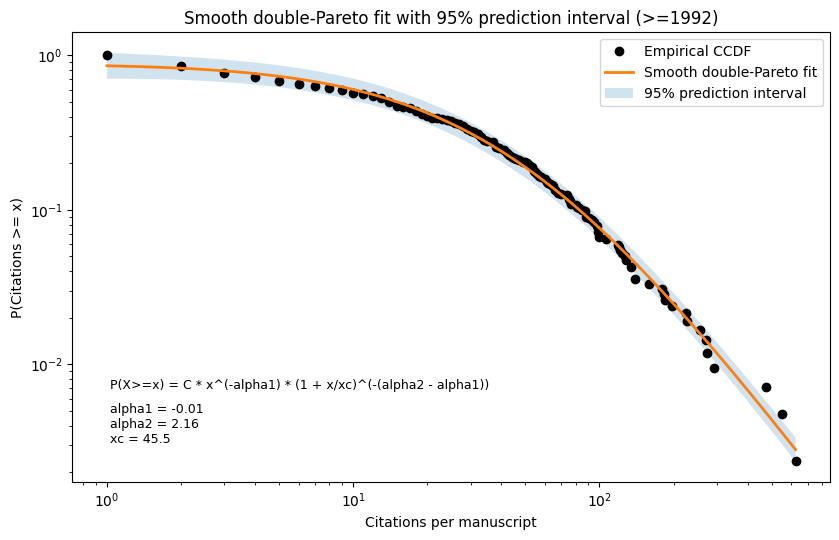
The obtained distribution is best described by a smooth double-Pareto model, characterized by:
• a low-citation (low-visibility, early-career, or new entries) regime, where scaling is weak or absent,
• a high-citation regime following a genuine power law with a slope above 2 (tail of the distribution),
• a smooth crossover at approximately 45 citations.
Importantly, the heavy-tailed component is not dominated by a single early contribution; it is populated repeatedly across the career span, indicating selective but sustained high impact. Double-Pareto distributions are observed across economics, urban systems, network science, and natural phenomena — preferential growth, entry of new contributors, selection, and saturation interact. Thus, the observed citation patterns can be explained within a broader class of adaptive systems.
Moreover, the presence of a smooth crossover (rather than a sharp break) can be interpreted (I think) as evidence of healthy system evolution, where growth is neither unconstrained nor artificially capped. The observed citation distribution is somewhat related to Lotka’s Law, one of the earliest empirical laws of bibliometrics. While Lotka described the power-law distribution of scientific productivity across authors, the present analysis examines the problem of impact across papers with time for a single authors.
h-index, m-index, and temporal consistency
At present, looking at data from Google Scholar, the following can be extracted:
• h-index = 62
• career m-index ≈ 1.8 (first peer-reviewed publication: 34 years ago)
• 5-year m-index ≈ 3, computed using only papers published in the last five years
An m-index close to 2 over more than three decades is well above the conventional benchmark (m ≈ 1) associated with sustained impact. More strikingly, the recent 5-year m-index exceeds the career average, demonstrating that newer publications are entering the h-core at least as fast as the earlier work: they are quite relevant to the field!
This pattern directly contradicts the late-career scenario in which citation metrics are driven primarily by legacy papers. Instead, it points to continued intellectual leadership and contemporary relevance. Layman (i.e. my) interpretation: I am not ready to retire yet; a few good ideas remain in this brain of mine 😉
Projection: what happens if nothing changes?
Using the quadratic and double Pareto models fitted to the 1992–2025 data, and assuming:
• stable publication rates,
• stable citation behaviour per paper,
• no change in the double-Pareto behaviour.
The expected total citation counts 10 years from now (2035) would be approximately 26,000 citations from about 420 manuscripts and an h-index close to or slightly above 80.
This projection does not rely on acceleration, step changes, or exceptional future events. It is the direct consequence of maintaining the same structural dynamics observed over the past decades. Alternatively, departure from this behaviour might signal major changes, either decrease or increase, in productivity. Will see …
What can—and cannot—be concluded
Taken together, the analyses support several, I would say robust conclusions:
• Citation growth is structurally cumulative, not speculative.
• Impact is heterogeneous but reproducible, with a persistent high-impact tail, i.e. continued entry of new work into the high-impact regime.
• Recent publications are at least as influential as earlier ones.
• Independent bibliometric indicators — time series, distributional models, and index-based metrics — are mutually consistent.
Equally important are the conclusions that cannot be drawn:
• There is no evidence of exponential runaway growth.
• No reliance on a small number of outlier papers – in fact, a large fraction of the published manuscripts have 10 or more citations (Google Scholar !10 index),
• No indication of declining relevance.
Not the finish line…yet!
From a bibliometrics standpoint, this combination — long-term stability coupled with ongoing contemporary strong performance — is both refreshing to the researcher I am and more informative than any single metric. What is perhaps less visible in bibliometric data, but no less important (I would even contend even more important), is how this body of work was produced.
During the first decade of my academic career, I was most often the first author or co-author on peer-reviewed manuscripts, reflecting a learning phase (under supervision!), establishing research directions, methods, and collaborations. Over the last two decades, this authorship pattern shifted completely. Today, approximately 78% of the manuscripts list trainees as first authors, spanning more than 200 individuals, from undergraduate researchers to postdoctoral fellows.
This transition is not incidental. It reflects a transition to independent researcher status and becoming an active supervisor and mentor. It also reflects on the strength and capacity of those themes to generate new questions, ideas, and solutions in the hands of emerging, bright young scientists. The sustained citation impact observed across the portfolio is therefore not driven by a single individual, but by the creativity, independence, and intellectual ownership of successive generations of trainees.
Seen from this perspective, this 300th peer-reviewed manuscript does not sit at the top of a personal achievement pyramid. It rests on a collective effort, built over time, in which mentoring, training, and scientific curiosity are inseparable from research output itself. I have also always been incredibly blessed to have had supervisors and mentors that were wonderful human beings. They created environments that were conducive to open discussion. I learned early on that having and sharing a good idea is not dependent on your level as a trainee, and that level should not prevent you from expressing yourself. They further granted me autonomy in my research activities, allowing me to explore new techniques, approaches, and ideas. However, they also provided me with the necessary supervision to steer the project back on track when things veered off course; I was encouraged to make mistakes, and it was perfectly acceptable.
Since then, I’ve been trying to replicate this approach. I always tell trainees that coming to the lab and conducting research should be enjoyable. It’s not always easy, and setbacks happen, but overall, the experience should be positive.
Thus, I will be eternally grateful to all the supervisors, mentors, colleagues, collaborators, but most of all the trainees that have joined (or will join) me in the roller-coaster adventure that is scientific research. It was, it is, and I hope, it will remain fun.
Reference
Ioannidis JPA, Baas J, Klavans R, Boyack KW. A standardized citation metrics author database annotated for scientific field. PLoS Biology. 2019;17(8):e3000384. https://doi.org/10.1371/journal.pbio.3000384
2025 update of the above manuscript accessible via DOI: 10.17632/btchxktzyw.8 (all data accessible, including the previous versions up to the first publication)
Harzing, A.W. (2007) Publish or Perish, available from https://harzing.com/resources/publish-or-perish
My Google Scholar page: https://scholar.google.com/citations?user=X4J8eVUAAAAJ&hl=fr